
Lab: Prepare a Flowchart for the Consolidation of Data Infrastructure
Estimated time: 30 minutes
Learning objectives
After completing this lab, you will be able to:
Illustrate the steps to consolidate dispersed data silos into an integrated and secure data infrastructure
Highlight key aspects of data storage, integration, quality, and privacy management within a governed data framework
Prerequisites:
For this lab, you can use Lucidchart. You only need the free version of LucidChart. If you choose to purchase a paid plan, you will be responsible for any associated charges. If you've not yet signed up for the free account, you can follow the instructions to get started. You may alternatively use applications like Microsoft Visio.
Introduction
Flowcharts are essential in integrating data silos into a single infrastructure because they provide clear, visual steps breaking down the complexity of any task. They improve communication, facilitate the alignment of stakeholders, and ensure systematic integration and quality checks concerning privacy.
Thus, flowcharts enable the identification of inefficiencies, regulatory compliance, and simplification in audits and serve as blueprints for future upgrades by visualizing dependencies and workflows, streamlining collaboration, troubleshooting, and ensuring the amalgamation process becomes efficient and scalable.
Scenario overview
A FinTech bank, FinEdge has grown rapidly, offering digital banking, lending, and financial advisory services. However, its data infrastructure is fragmented, storing customer and transaction data across multiple siloed systems. This has led to inconsistent reporting, data duplication, high operational costs, and difficulties meeting regulatory compliance. FinEdge aims to consolidate its data infrastructure into a centralized cloud-based platform to address these challenges. By integrating data from all departments, standardizing reporting with a unified BI tool, and implementing strong data governance, the bank can enhance decision-making, ensure compliance, and reduce costs, positioning itself for scalable growth and innovation.
Exercise: Prepare a flowchart for consolidation of data infrastructure for a fintech bank using Lucidchart
In this lab, you will create a detailed flowchart for consolidating dispersed data silos of a fintech bank into a unified, secure, and governed data infrastructure. The flowchart will help you navigate significant steps such as optimization of data storage, integration of systems, quality control of data, and privacy management protocols. You will design a step-by-step instructional visual for the consolidation process that will assist in the specification of clear, structured, and coordinated design to optimize efficiency, consistency, and compliance in the data infrastructure.
Let's begin!
Step 1: Identify and categorize existing data silos
Objective: Understand where the bank's data currently resides and its formats
Flowchart representation:
Represent each data silo as a circular node, clearly labeled with names such as Customer Database, Payment Gateway Data, and Loan Applications
Group these nodes under a section titled Data Sources to indicate their origin and highlight their role as inputs in the data consolidation process
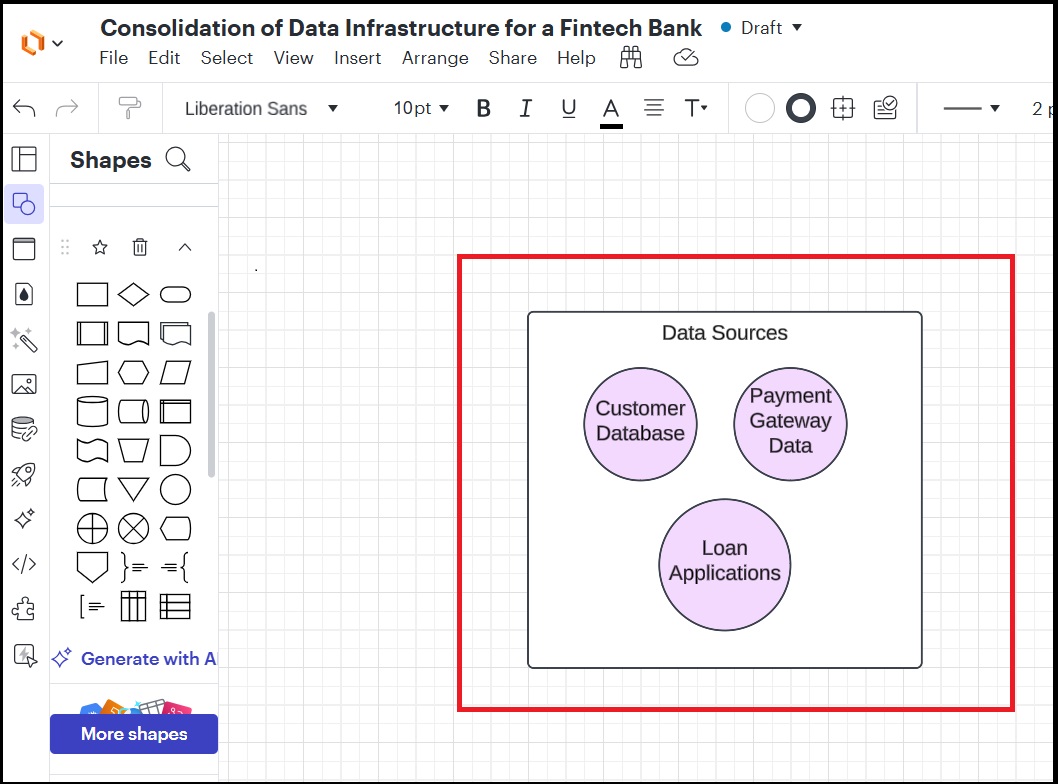
This structure ensures clarity by categorizing and visually organizing the various data sources feeding into the unified infrastructure.
Step 2: Define data ingestion mechanisms
Objective: Establish how data from silos will be ingested into a consolidated infrastructure
Flowchart representation:
Add a rectangular node labeled Data Ingestion Layer to represent the process of collecting and importing data from various silos
Connect this node to circular nodes representing the silos (e.g., Customer Database, Payment Gateway Data) using arrows to indicate data flow
Include a diamond-shaped node labeled Validation Checks connected to the Data Ingestion Layer to represent the step where data is verified for accuracy, completeness, and consistency before proceeding
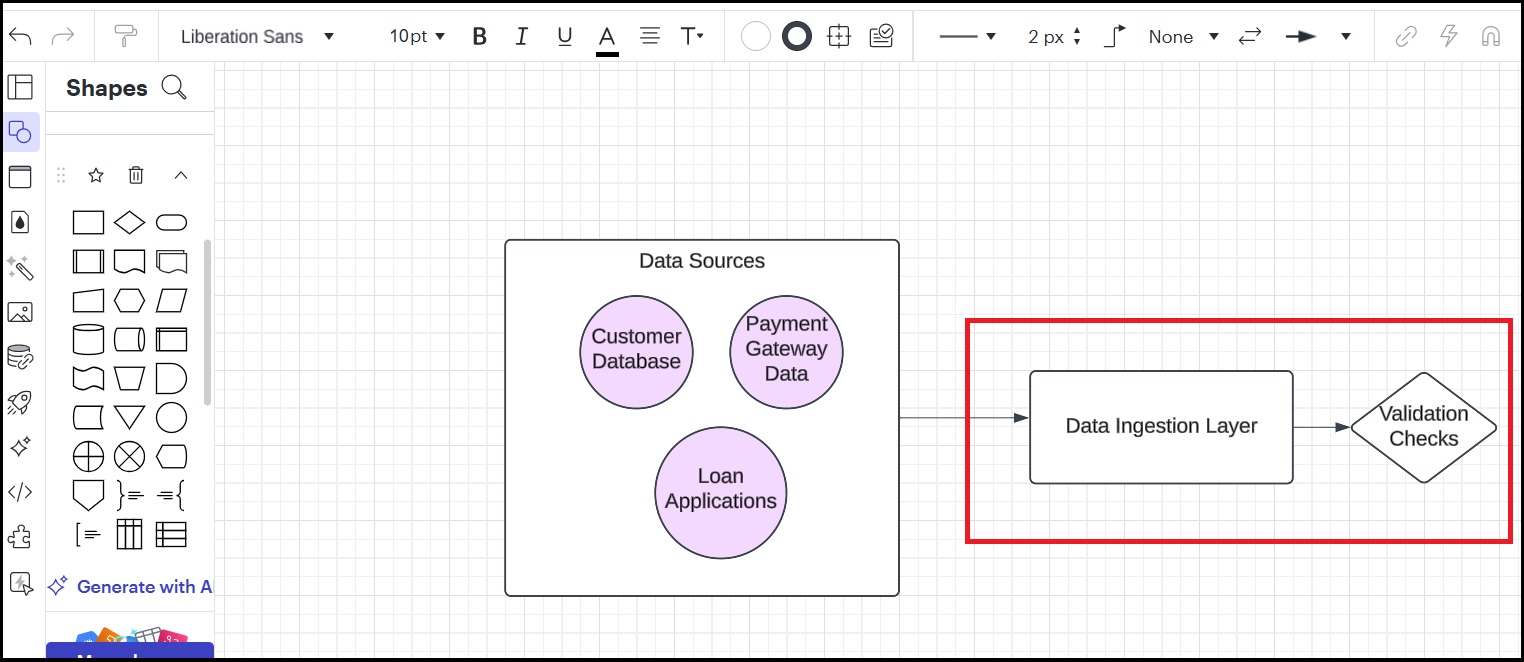
This setup clearly depicts the transition from raw data sources to the quality assurance stage.
Step 3: Design data storage architecture
Objective: Consolidate data into centralized storage systems while maintaining scalability
Flowchart representation:
Use cylindrical nodes to represent storage solutions, labeling them as Data Lake (Raw Data) and Data Warehouse (Structured Data) to differentiate raw and processed data storage
Connect the Validation Checks diamond-shaped node to these cylindrical nodes using arrows to illustrate the flow of validated data into appropriate storage systems.
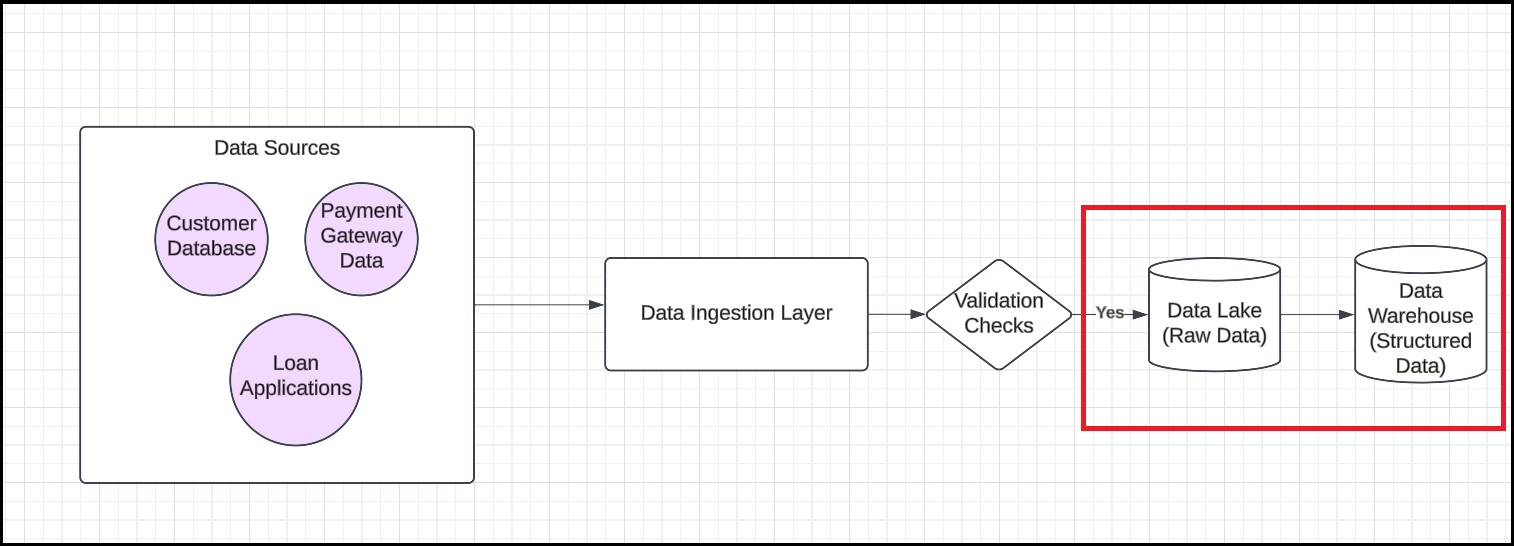
This visual structure highlights the transition from the quality assurance stage to designated storage layers, ensuring secure management of both raw and structured data for further use.
Step 4: Incorporate data integration
Objective: Enable interoperability and seamless flow of data across systems
Flowchart representation:
Add rectangular nodes labeled ETL/ELT Tools and Integration APIs to represent data transformation and system connectivity
Connect the storage nodes (Data Lake (Raw Data) and Data Warehouse (Structured Data)) to these integration tools using arrows, illustrating the flow of data as it is extracted, transformed, and loaded (ETL/ELT) or accessed through APIs
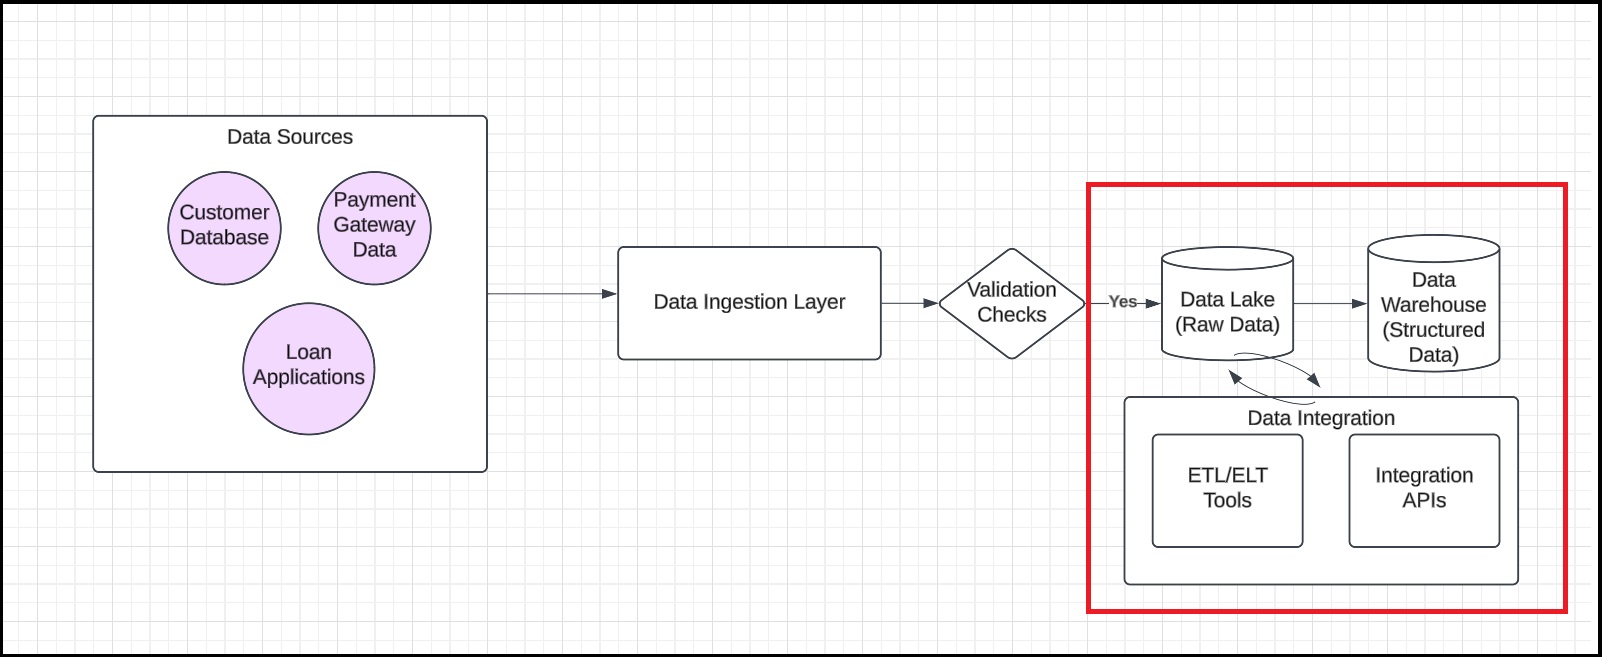
This setup highlights how integration tools facilitate seamless data movement and preparation for downstream applications and systems.
Step 5: Ensure data security and privacy
Objective: Protect sensitive financial data throughout the consolidation process
Flowchart representation:
Add shield-shaped nodes labeled Encryption Layer and Access Controls to represent security measures
Connect these nodes to storage layers (Data Lake (Raw Data) and Data Warehouse (Structured Data)) and integration tools (ETL/ELT Tools and Integration APIs) using arrows to indicate secured data flow
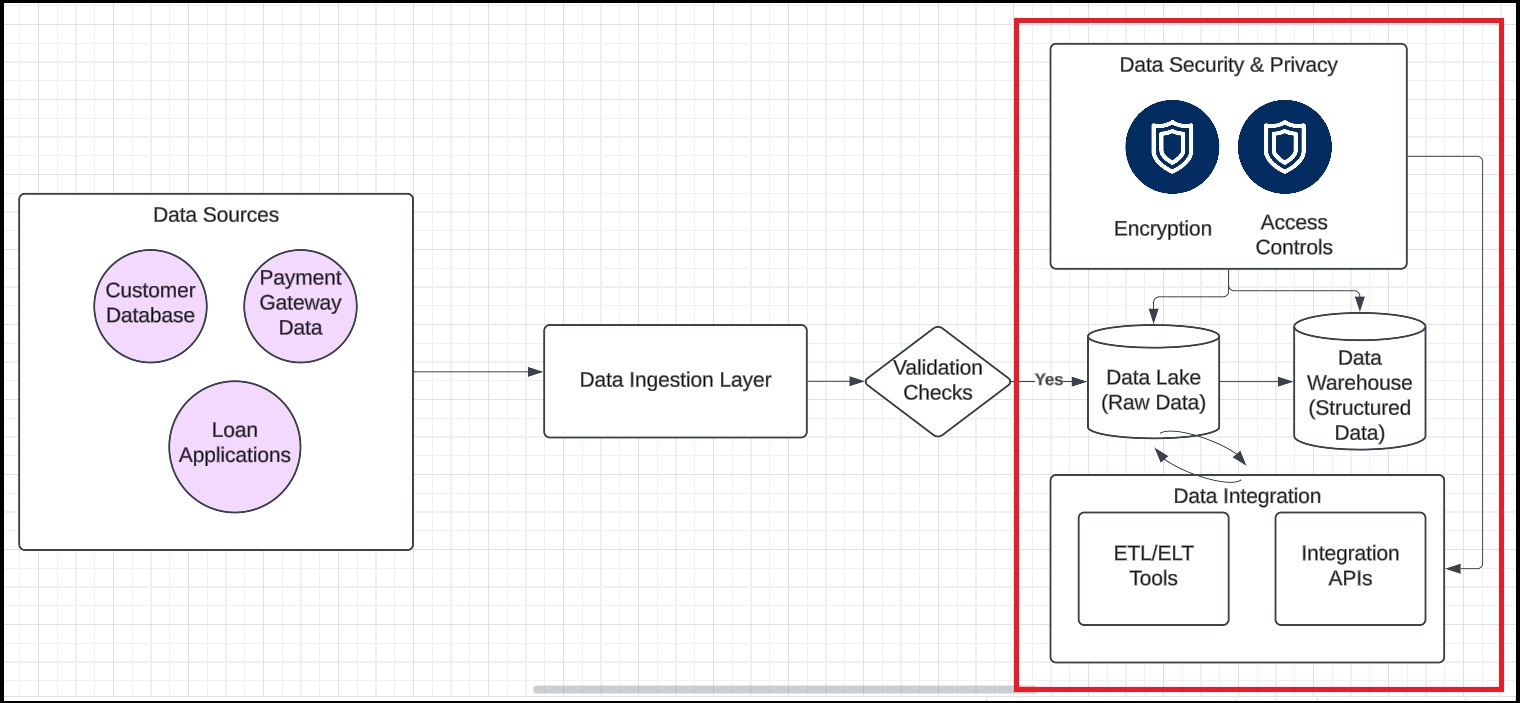
This setup highlights how encryption and access controls are applied at critical stages to ensure data security, privacy, and restricted access throughout the consolidation process.
Step 6: Establish metadata management
Objective: Document and maintain information about data assets for discoverability and governance
Flowchart representation:
Add a rectangular node labeled Metadata Repository to represent the centralized system for storing metadata, including definitions, lineage, and usage details
Connect this node to storage layers (Data Lake (Raw Data) and Data Warehouse (Structured Data)) using arrows to illustrate how metadata is collected and maintained alongside stored data
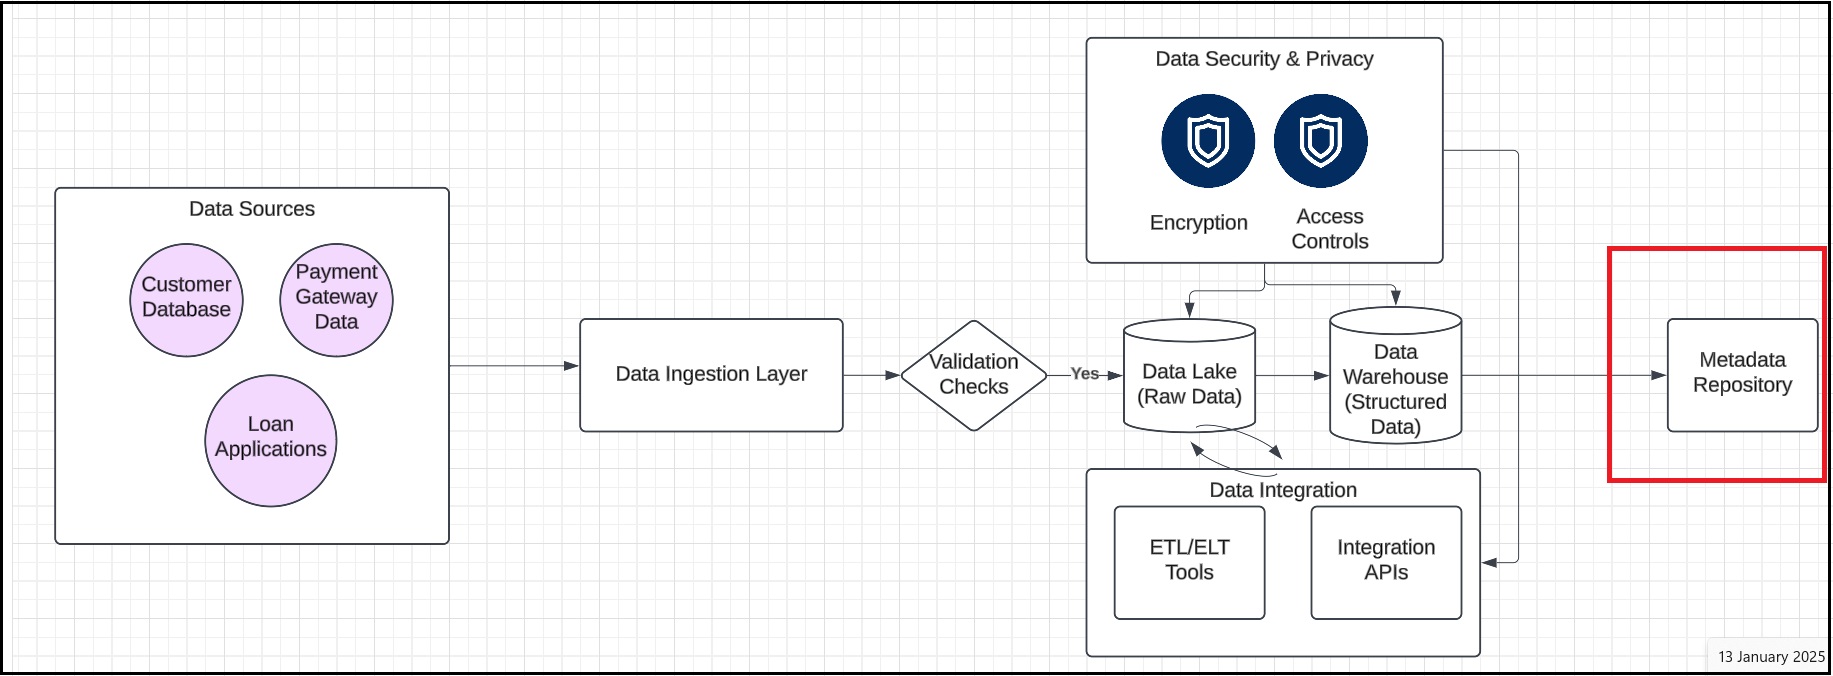
This setup highlights the role of metadata in enhancing data governance, traceability, and overall management within the consolidated infrastructure.
Step 7: Address data quality management
Objective: Ensure data accuracy, completeness, and consistency
Flowchart representation:
Add diamond-shaped nodes labeled Data Quality Checks to represent processes ensuring data accuracy, consistency, and reliability
Connect these nodes to both the Data Ingestion Layer and storage layers (Data Lake (Raw Data) and Data Warehouse (Structured Data)) using arrows, illustrating validation at multiple stages.
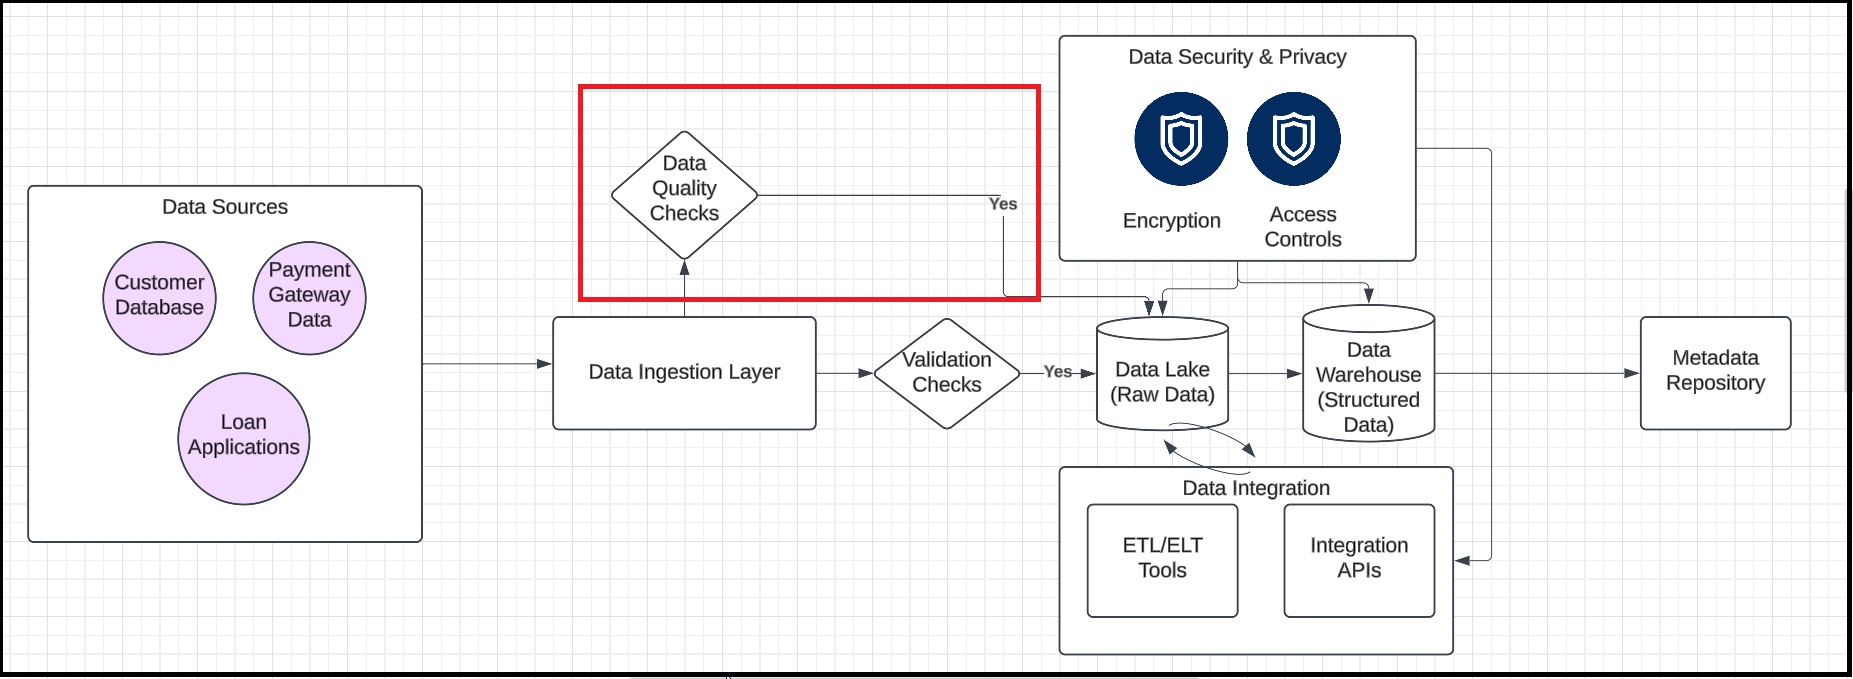
This setup emphasizes how data quality is enforced during ingestion and after storage, maintaining the integrity of the consolidated data infrastructure.
Step 8: Prepare for reporting and analytics
Objective: Enable advanced analytics and reporting for decision-making and compliance
Flowchart representation:
Add rectangular nodes labeled BI Tools and Regulatory Reporting to represent business intelligence analysis and compliance reporting systems
Connect these nodes to the Data Warehouse (Structured Data) using arrows to illustrate how structured data flows into these tools for analysis and reporting
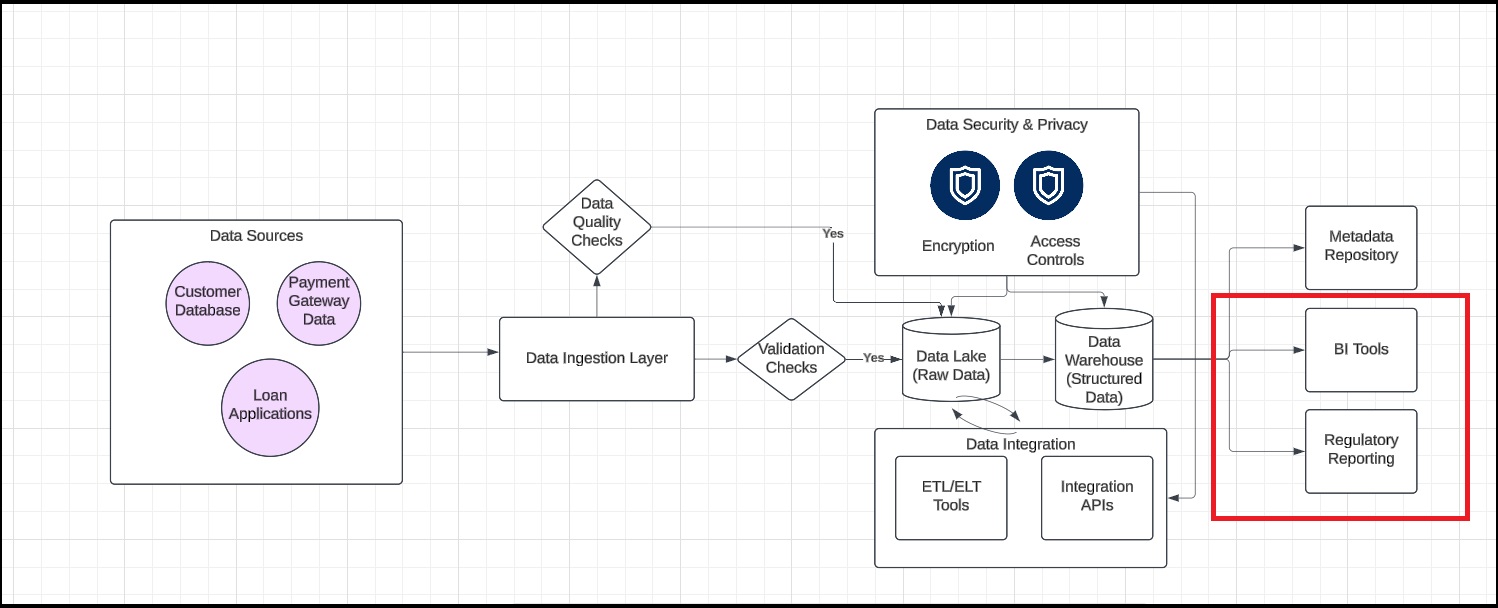
This setup highlights the data warehouse's role in supporting decision-making and compliance by providing accurate, accessible data to downstream applications.
Step 9: Finalize the flowchart
Objective: Ensure the flowchart is complete and accurately represents the data consolidation process
Review & validate: Engage stakeholders to review the flowchart and provide feedback
Annotate nodes: Add tooltips describing the functionality of each component to enhance understanding
Enhance clarity: Include legends and labels to clearly define symbols, processes, and data flows
This setup ensures the flowchart is well-documented, easy to interpret, and aligned with stakeholder expectations.
Summary
Congratulations on completing the hands-on lab Prepare a Flowchart for the Consolidation of Data Infrastructure. In this lab, you learned how to create a detailed flowchart for consolidating dispersed data silos of a fintech bank into a unified, secure, and governed data infrastructure.