
Lab: Create an EDA Blueprint
Estimated time: 30 minutes
Learning objectives
After completing this lab, you will be able to:
Design a scalable, secure, and efficient data architecture blueprint to optimize supply chain operations
Enable effective decision-making and ensure compliance through tailored data architecture solutions
Prerequisites:
You can complete your tasks using any text editor, such as Word, Google Docs, or Notepad.
If you install Microsoft Word, you can proceed directly with the instructions. However, if you don't have Microsoft Word, you can sign up for a free version of Microsoft 365 online. Follow these instructions to create your account.
You can also use Word Online with a Microsoft 365 subscription or access through a free account. If you're new to Word and would like to learn how to get started, you can find helpful resources here: Getting Started with Word Online.
For this lab, you can use Lucidchart. You only need the free version of LucidChart. If you choose to purchase a paid plan, you will be responsible for any associated charges. If you've not yet signed up for the free account, you can follow the instructions to get started. You may alternatively use applications like Microsoft Visio.
Introduction
Reliable and accurate data is the foundation of effective strategy development and decision-making in today's data-driven landscape.
Enterprise Data Architecture (EDA) provides a structured framework for collecting, storing, integrating, and managing data. In a supply chain company, a well-designed EDA ensures:
Seamless data flow across systems
Improved data consistency and accessibility
Maintained data quality
By adopting a structured EDA approach, supply chain companies can enhance operations, make informed decisions, and stay competitive in a rapidly evolving market.
Scenario overview
A supply chain company aims to streamline operations and improve decision-making by developing an Enterprise Data Architecture (EDA) blueprint. The process begins with identifying key data sources, such as inventory systems, transportation logs, supplier databases, and customer orders. The team defines data flow processes, integrating real-time tracking and analytics platforms. Using cloud-based solutions, they establish a centralized data lake for seamless storage and retrieval. The blueprint outlines data governance policies, ensuring security and compliance. Advanced analytics tools are incorporated to forecast demand, optimize routes, and reduce costs. This comprehensive EDA blueprint becomes the foundation for the company's digital transformation journey.
Exercise: Create an Enterprise Data Architecture blueprint for a supply chain company
In this lab, you will design an enterprise data architecture blueprint for a supply chain company that provides raw materials for garment manufacturing. The blueprint will focus on core components: data sources, ingestion, storage, processing, analytics, and governance.
You will be guided step by step to design a framework that ensures efficient data flow, scalability, and compliance. By the end of this lab, you will have a comprehensive and structured data architecture plan tailored to streamline supply chain operations.
Template to use
If you are using Microsoft Word, right-click the link and download the template document. You can use the template to perform the tasks outlined in the lab.
You can also use the PDF format for any other word-processing software.
Task 1: Understand business requirements: Identify the specific data requirements for optimizing supply chain operations.
Step 1: Compile a list of all critical data sources
Example
| Key data resources |
|---|
| Supplier database |
Step 2: Define practical applications for the data
Example
| Critical use cases |
|---|
| Inventory forecasting |
Step 3: Outline the data compliance standards and regulations that must be followed
| Data compliance requirements | Description |
|---|---|
| GDPR |
|
Task 2: Identify and define the core components of data architecture
Step 1: Data sources: Identify and categorize all internal and external data sources
Example:
| Data source type | Examples |
|---|---|
| Internal | ERP systems, warehouse management systems, production logs |
| External | Supplier APIs, weather data, market trends |
Step 2: Data ingestion: Establish the data ingestion methods.
Example
| Ingestion method | Description | Examples | Tools |
|---|---|---|---|
| Batch ingestion | Processes data at scheduled intervals | Daily supplier reports | Apache Kafka, AWS Kinesis, Talend |
Step 3: Data storage: Define the data storage types
Example
| Storage type | Purpose | Examples |
|---|---|---|
| Data Lake | Stores raw, unprocessed data | Hadoop, AWS S3 |
Step 4: Data processing: Define the data processing methods
Example:
| Processing method | Description | Examples |
|---|---|---|
| ETL/ELT pipelines | Transform raw data for further analysis | Apache Spark, Talend, AWS Glue, Microsoft Azure Data Factory |
Step 5: Analytics: Identify and report business intelligence capabilities
Example:
| Analytics type | Description | Examples/Use cases | Tools |
|---|---|---|---|
| Dashboards | Visualize key metrics such as inventory levels, supplier performance, and cost analysis | Inventory levels, supplier performance, cost analysis | Tableau, Power BI |
Step 6: Data governance: Define the data governance tasks.
Example:
| Governance tasks | Description | Examples/Tools |
|---|---|---|
| Data ownership & stewardship | Define roles and responsibilities for data management | Collibra, Alation |
Task 3: Create the blueprint using Lucidchart
Step 1: Set-up the core layers
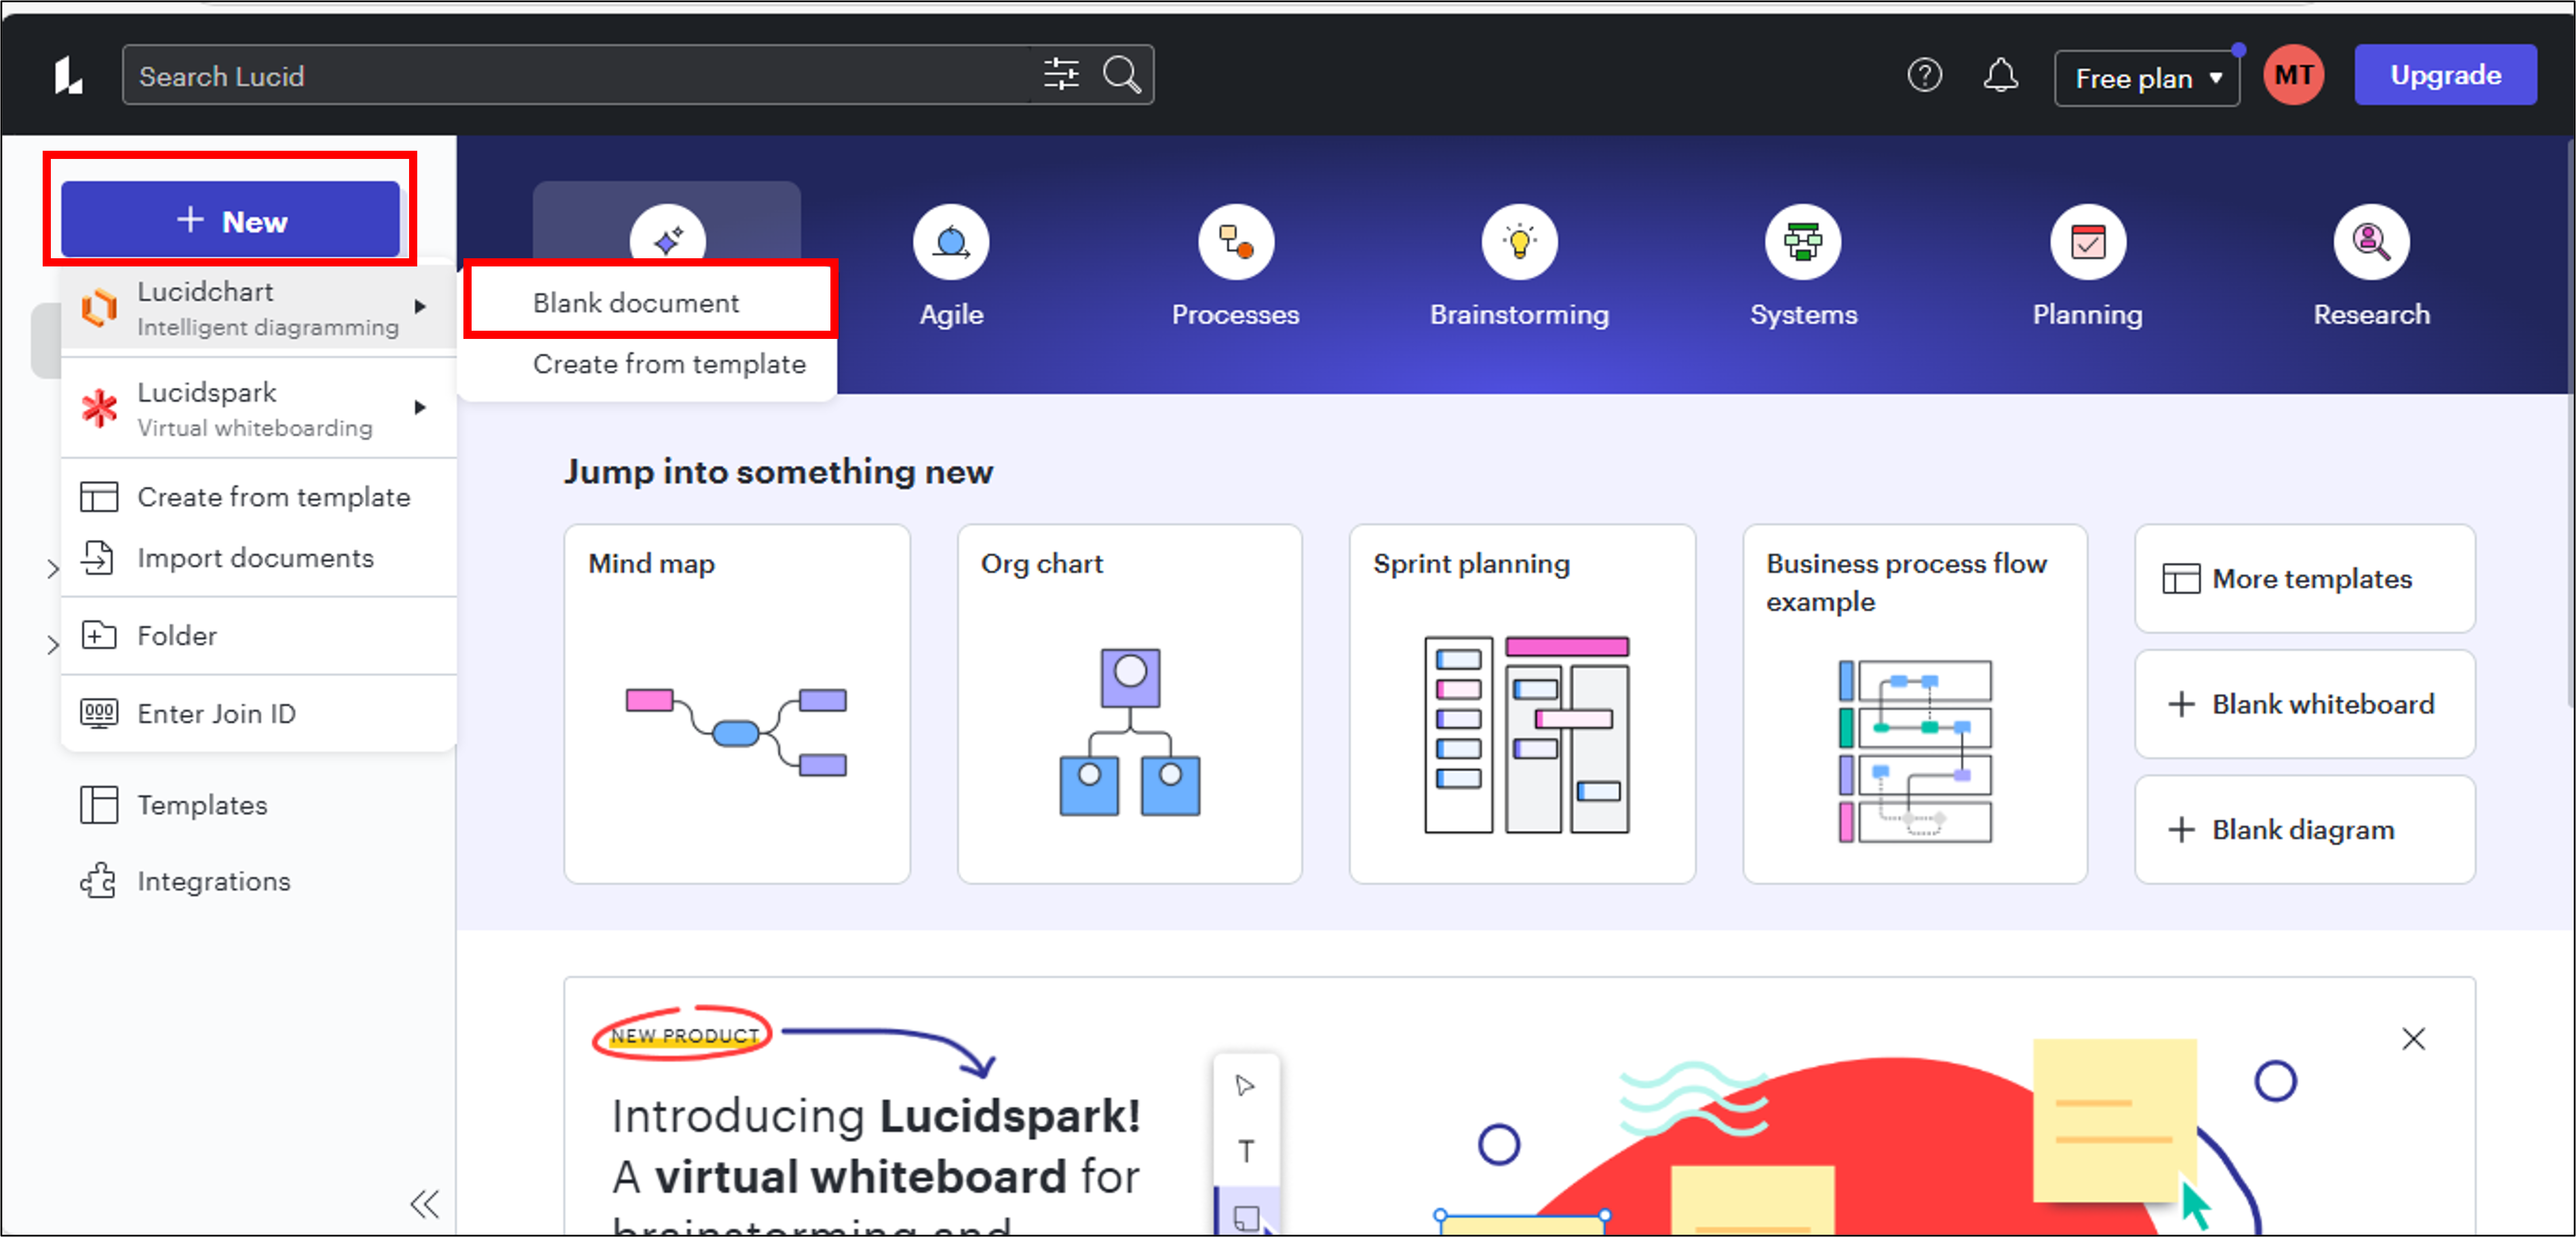
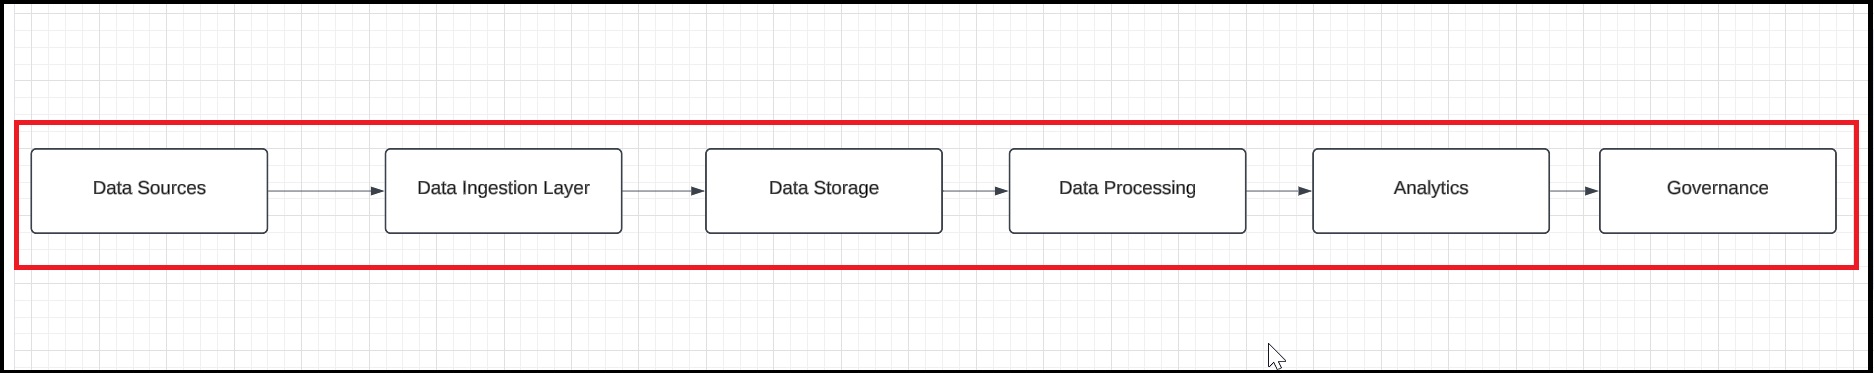
Open Lucidchart and click the New button, then select Blank Document to create a new diagram. Add six rectangular shapes, each representing a core section: Data Sources, Data Ingestion, Data Storage, Data Processing, Analytics, and Governance. Finally, connect these sections with arrows to illustrate the data flow between them.
Step 2: Populate the data-sources
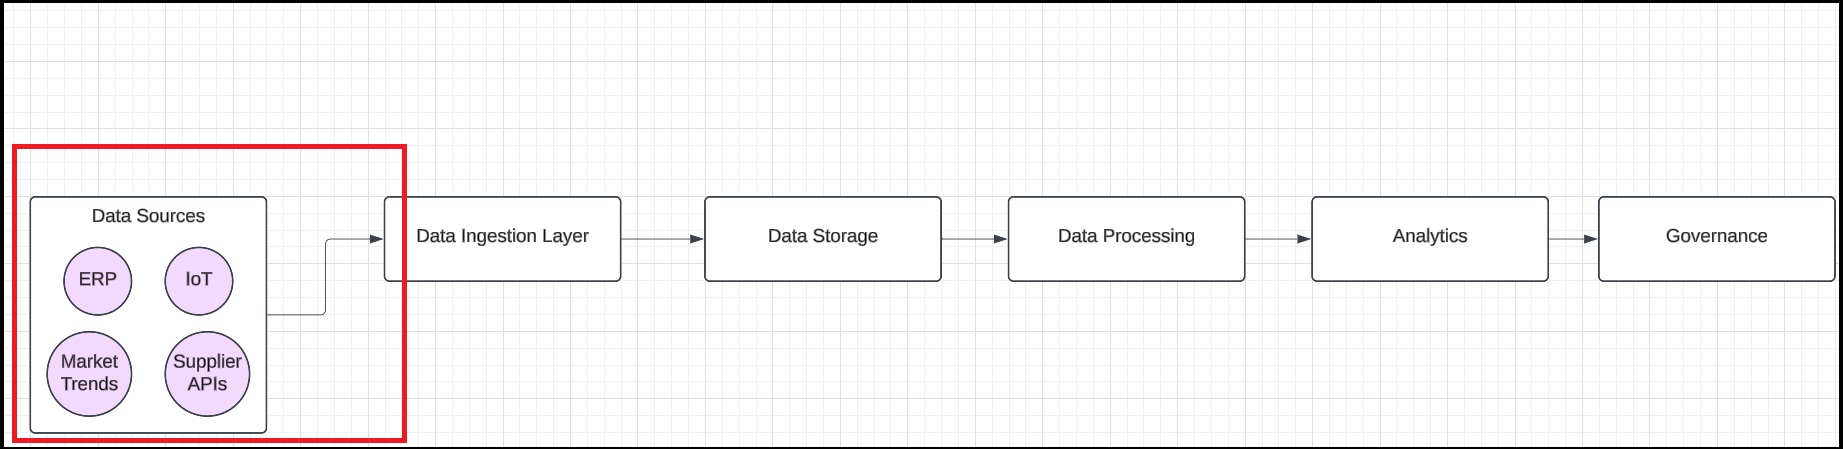
Drag and drop circular shapes to represent data sources (e.g., Supplier APIs, ERP system, IoT devices, Market Trends API) and connect them to the Data Ingestion Layer with arrows.
Step 3: Design data ingestion
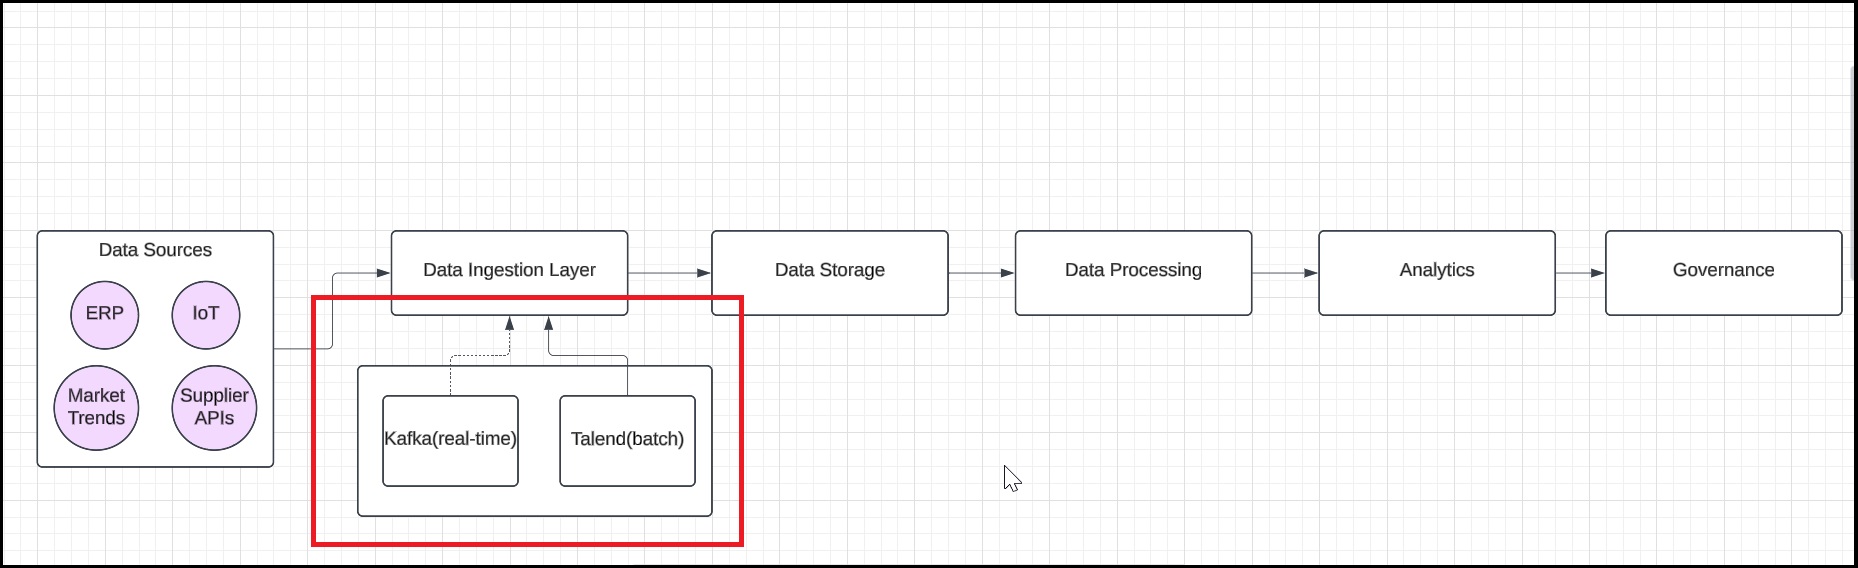
List the tools and mechanisms (e.g., Kafka for real-time, Talend for batch) under the rectangle labeled Data Ingestion Layer and annotate the arrows to specify batch or real-time ingestion.
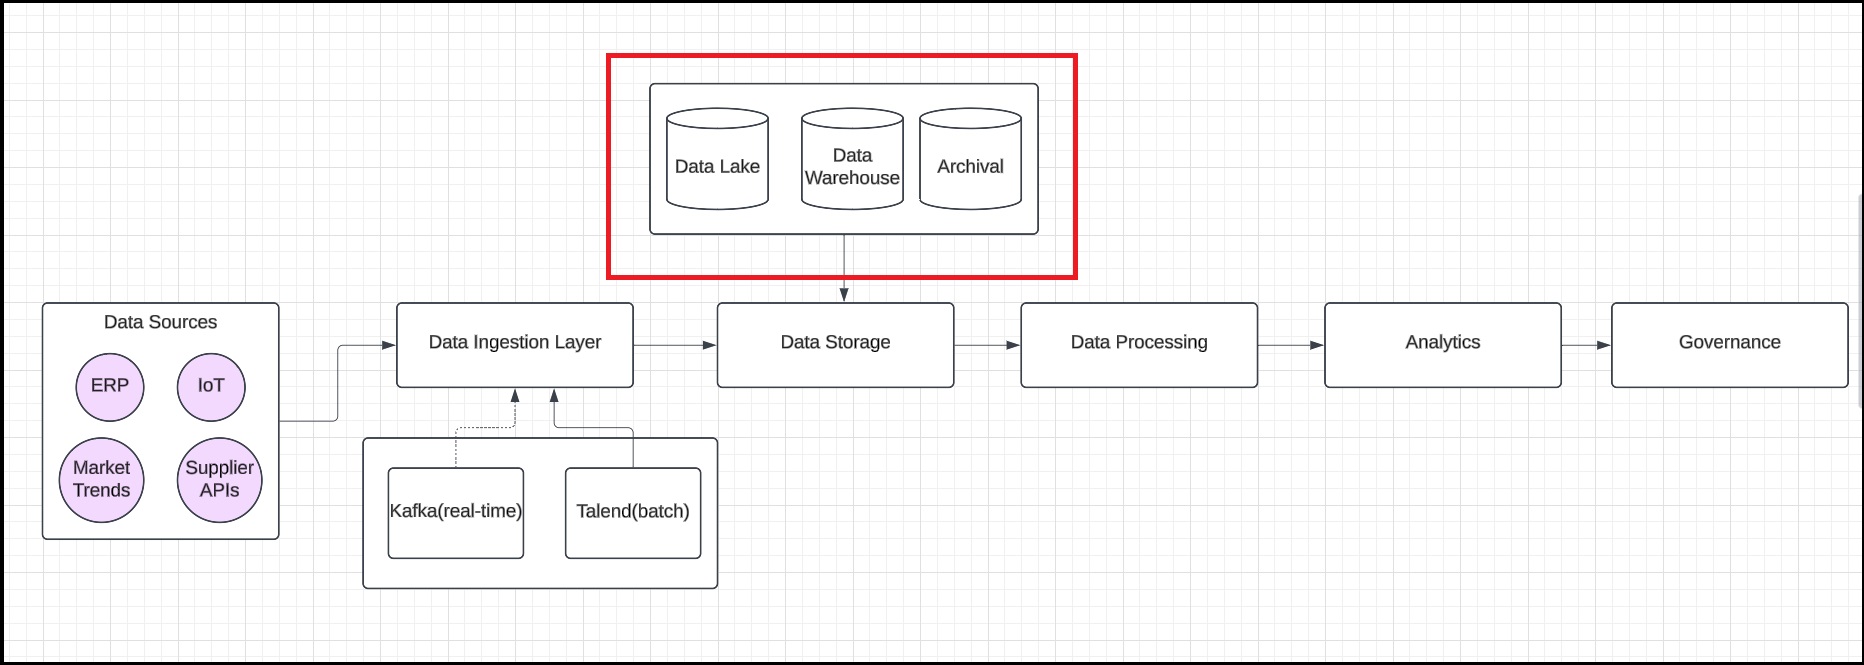
Step 4: Define the storage architecture
Add cylinder shapes to represent each storage tier: Raw Data for the Data Lake, Structured Data for the Data Warehouse, and Archival Storage. Then, establish connections from all storage tiers to the Data Storage box.
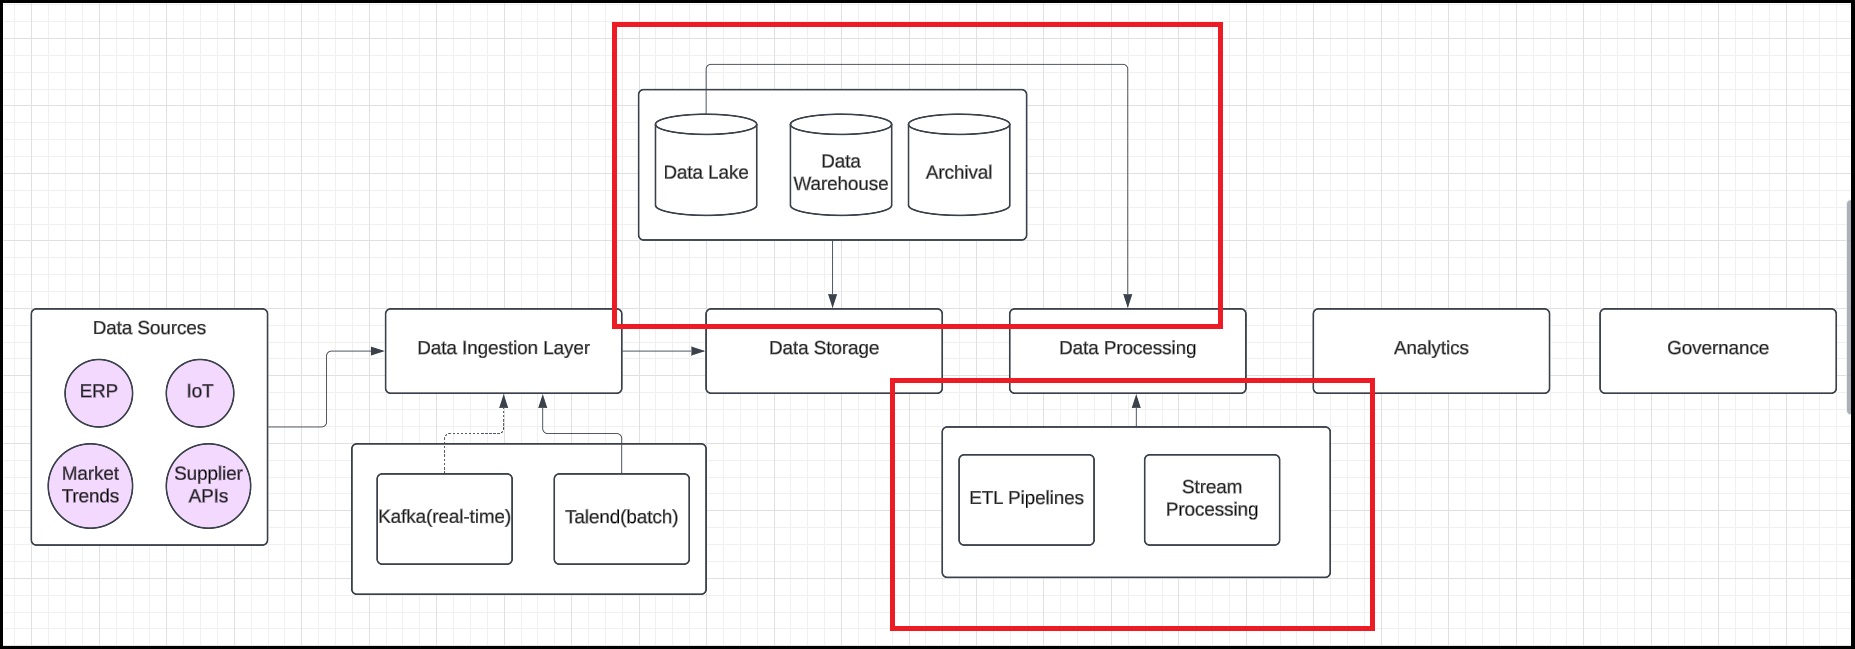
Step 5: Detail data-processing
Under the Data Processing Layer rectangle, list the processing methods, such as ETL pipelines for data cleaning and transformation and stream processing for real-time analysis. Then, connect the data lake to the processing layer to illustrate the data flow.
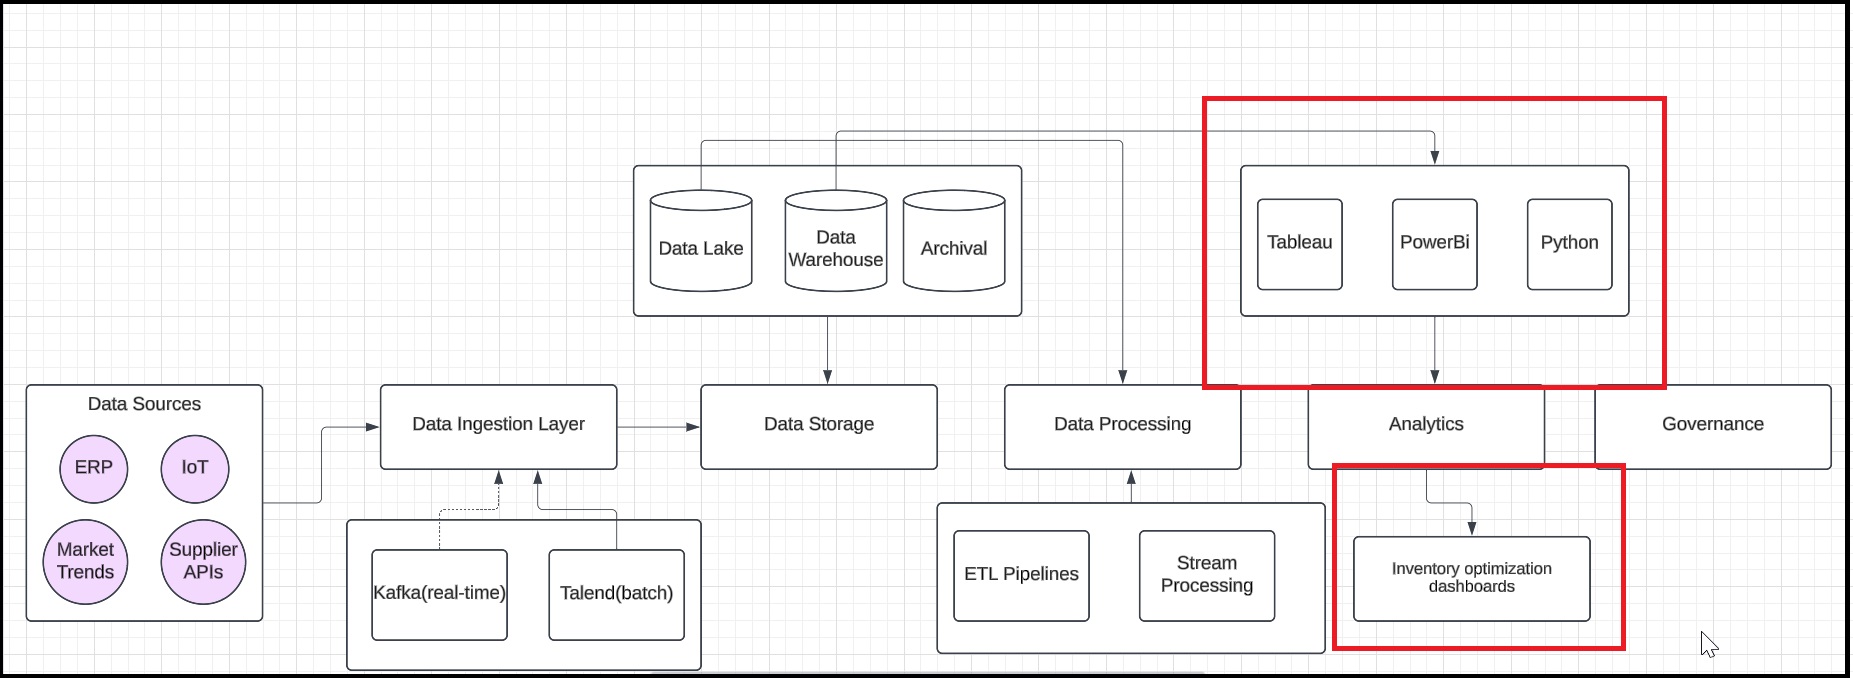
Step 6: Map the analytics
Create rectangular shapes to represent analytics tools, such as Tableau, Power BI, and Python scripts. Next, establish connections between the data warehouse and these analytics tools to illustrate how data flows for analysis. Finally, include an example output, such as an inventory optimization dashboard, to demonstrate the insights generated from the data.
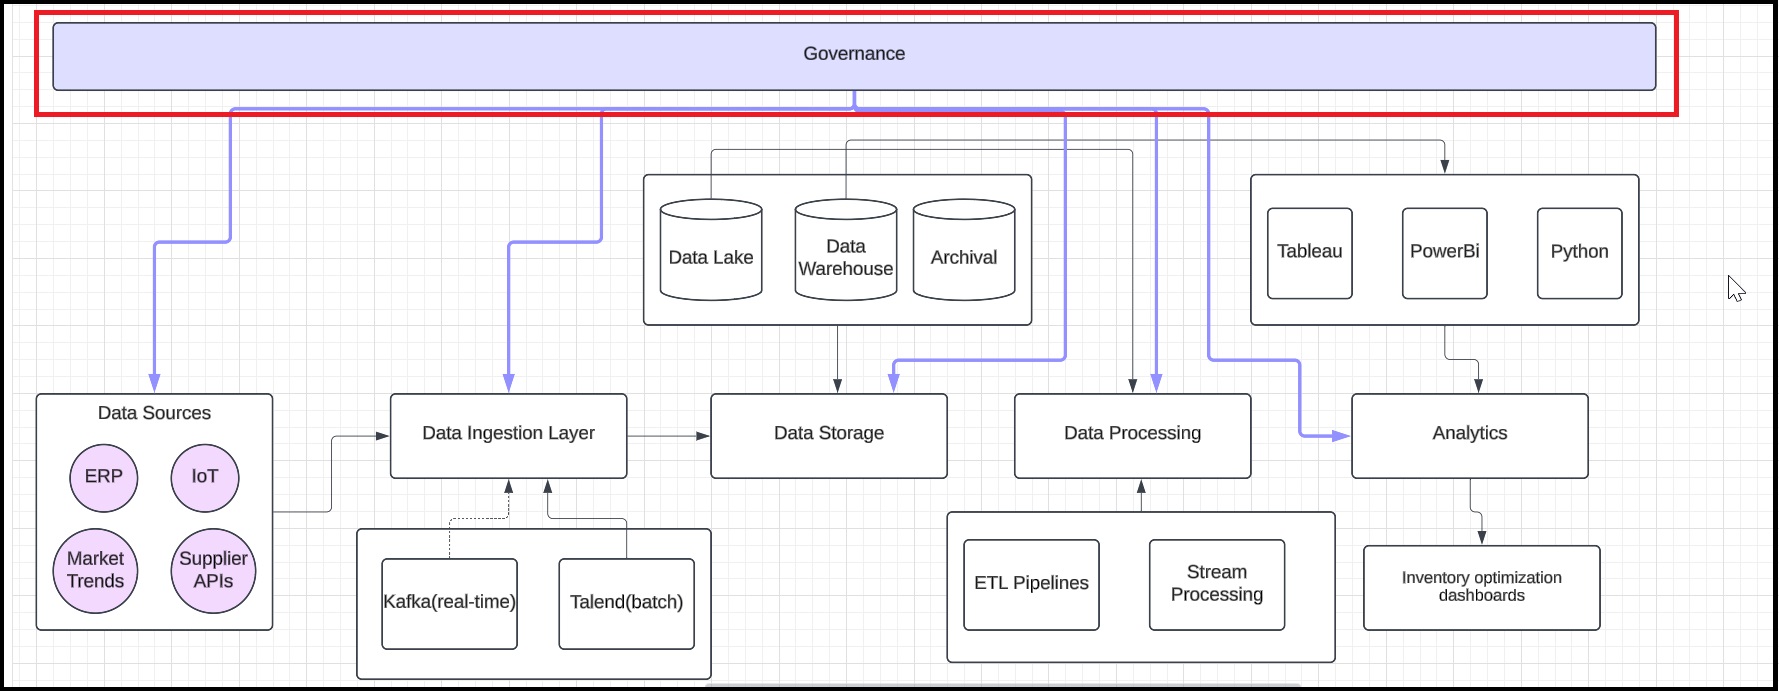
Step 7: Illustrate data governance
Add a rectangle labeled Data Governance at the top and connect it to all layers.
Step 8: Finalize and share the blueprint
Export the blueprint in PDF or PNG format to ensure clarity and accessibility. Then, integrate the exported file into the documentation to support the implementation process, providing stakeholders with a clear visual reference.
Summary
Congratulations on completing the hands-on lab: Create an EDA Blueprint. In this lab, you explored how to design an enterprise data architecture blueprint for a supply chain company.
Here is the exemplar document for your reference.
Right-click to open the file. Please remember that the exemplar is just a point of view and not a definitive solution.